Data and information makes your asset management world spin. You need data about your assets, your services, your performance, your finances and more for effective asset management planning and decision-making. It will take time to get there and collect the data that you need, it’s an important part of your asset management journey. But don’t wait until your data is perfect, make assumptions and keep moving forward.
“Getting the data is the hardest part, and it’s an ongoing effort. It’s not a crisis or emergency that you can see and resolve, but you have to set aside time to collect the data you need. You need to make it a priority.”
Gordon Duff, Treasurer and Deputy CAO, Town of Minto, Ont.
For most of you, your TCA report will give you a great starting position. It should list out all the capital assets you are responsible for. During your TCA processes, you probably debated what level to record your assets at. What is an asset? Where do you draw the line? The concept of an “Asset Hierarchy” is used by various different industries to provide you with a structured way of consistently breaking down the assets in your organization. Each level of your asset base and the different components will have different renewal points – for example the concrete foundation of your water treatment plant should last 50+ years, but your HVAC systems are only forecast to last 15 years. With this information you can start to create better life cycle investment requirements for your assets.

You might hear people talk about vertical and linear assets. Vertical assets are typically referred to as single location assets like buildings, bridges, treatment plants, etc. Linear assets are typically assets that span an area like underground pipes, roads, etc. Due to their very different nature, they can often be managed in different systems, and Geographic Information Systems (GIS) are often used specifically for linear assets.
Do I need to purchase some kind of application or IT system?
No, you can start with using spreadsheets to get an understanding of what assets you own, maintain, operate, etc. Larger, more expensive systems can help but make sure you have the proper business processes in place to get, and maintain the data needed for those large systems. If using spreadsheets, be careful that you manage access, reduce duplication, share the data, and make appropriate backups.

Understanding your customer level of service
Service performance data is something that municipalities generally find harder to collect and evaluate. As explained in the introduction, assets exist to deliver value to our customers and communities. In the municipal context, we refer to this value to the community as “Levels of Service”. Level of service frameworks help you as an organization measure what the community is receiving, and how effective you are as an organization at delivering those services. The key is understanding the difference between the customer levels of service that the customers actually feel, and the technical levels of service measures that are important to manage your services as an organization, but are too detailed for the community to understand and connect with. Armed with this information, along with the cost of delivering service, you can get into more informed discussions with your community about what they really want from their services, and more importantly what they are willing to pay for.
“Peter Drucker put it best: ‘Quality in a product or service is not what the supplier puts in. It is what the customer gets out and is willing to pay for.’ In a nutshell, the Customer Level of Service describes and measures the service outcomes that citizens get from the municipality for the taxes and rates they pay annually which contribute to their overall quality of life in the community. Our public consultation focus groups provided valuable feedback on satisfaction with and priorities for Utility services and also confirmed that our list of service goals was fairly complete from our customer’s perspective.”
Loretta Gette, Senior Engineer, City of Regina, Sask.
What about asset condition, remaining life, and replacement cost?
Understanding the condition of the assets that you are responsible for is an important component, and municipalities across Canada are moving to utilize a consistent five-point scale when talking generally about their asset bases: very poor, poor, fair, good, and very good.
“One of the biggest challenges many municipalities experienced in completing the survey for the 2012 CIRC was reporting asset condition in a consistent manner. Consistency is important to promote an accurate understanding of the state of Canada’s municipal infrastructure. When all municipalities are on the same page about how to grade the condition of their infrastructure, comparisons become more realistic. In addition, a standardized condition grading system across Canadian municipalities is easily repeatable, enabling comparison of the status of infrastructure condition over time.”
CIRC’s condition grading system
Very Good: Fit for the future
Well maintained, good condition, new or recently rehabilitated.
Good: Adequate for now
Acceptable, generally approaching mid stage of expected service life.
Fair: Requires attention
Signs of deterioration, some elements exhibit deficiencies.
Poor: At risk of affecting service
Approaching end of service life, condition below standard, large portion of system exhibits significant deterioration.
Very Poor/Critical: Unfit for sustained service
Near or beyond expected service life, widespread signs of advanced deterioration, some assets may be unusable.
Don’t have actual condition data?
That’s ok, in your early stages you can use opinions of staff who are familiar with the assets, or even age. The table below from 2016 CIRC shows how to translate age and Estimated Service Life (ESL) to a condition grade. This is something you can do with your Asset Inventory and some spreadsheet calculations.
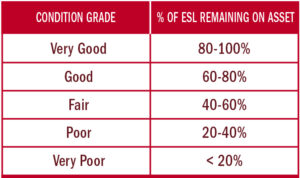
TIP: It’s good to sense-check the condition results from the above age/ESL calculation against opinions of your staff who are familiar with the assets and adjust accordingly.
It’s not possible for everything in the community to be ‘Very Good’ and it’s not necessary. It’s good to have a blend across your asset portfolio.
Understanding the estimated remaining life of an asset – and in our context this is captured in years – is important as this gives you an understanding of when you will have to replace, upgrade, and dispose of this asset. This is different to the engineered design life, as it often doesn’t take account of your operating conditions and the actual remaining life could be better or worse.

According to the 2015 AMO Study, The State of Ontario’s Roads and Bridges, which analyzed real asset data from 93 municipalities, assets with real condition ratings are performing better than their age and expected useful life would suggest. Where possible, municipalities are encouraged to conduct condition assessments on their assets to obtain a clearer picture of the true state of their infrastructure, allowing for a better-informed asset management strategy.
“It’s important to be aware of the quality of your data, poor data is going to give you a poor plan. We did condition assessments for certain critical assets and some asset classes, but still used age-based estimate for much of our asset base. As we evolve our asset management practices we will be doing more real-world condition assessments”
Jeffrey Morrison, Director, Corporate Services, Town of Essex, Ont
“It’s important to understand the value of your current asset base. It could be alarmingly higher than you think. Through the PSAB TCA reporting, municipalities included debt as liability, however we weren’t offsetting the value of the assets, now with the asset management information it’s in balance. We know what work needs done over the next 10-20 years and we can be ready for it.”
Tony Haddad, Chief Administrative Officer, Town of Tecumseh, Ont
Note: The financial value of an asset in your TCA Report may be different to the replacement cost that you use in your asset management activities. The numbers can serve a different purpose. Some municipalities opt to manage their Asset Management-Asset Register very separately from their TCA Accounting-Asset Register.
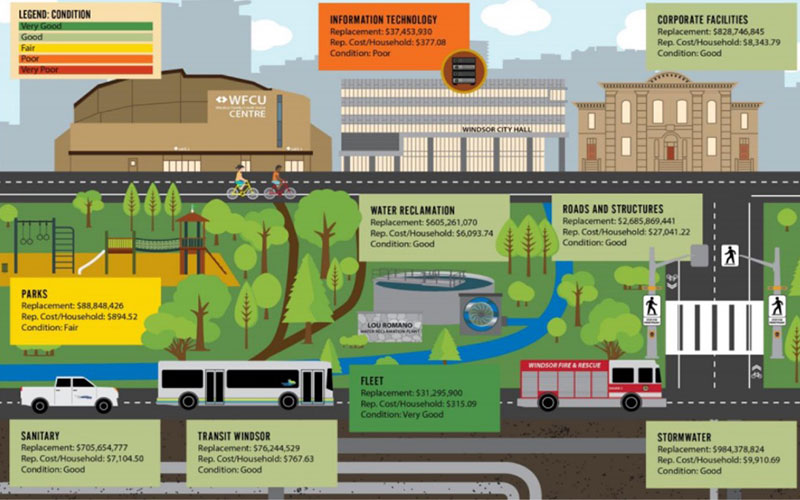
The City of Windsor has developed an infographic that shows the collation of some of their asset management data in an easy-to-explain format. Being able to communicate a clear picture of the infrastructure that your community services depend on, along with condition and financial areas of concerns, is a powerful tool.
Having the data is only part of it: what are you using the data for? Start using it in your processes and think about what data you need to make decisions and you’ll soon see what data is important. The level of accuracy can vary and that’s ok, you just need to be aware.